Debug Helpers
On this page, we list various packages which help with debugging and profiling a Neos/Flow installation.
#Content Repository Debugger
This package by Sebastian Helzle allows to output the Node Types of your Neos CMS project as various types of graphs via a backend module.
It helps understanding dependencies between packages and nodetypes. Also it shows which nodetypes are actually being used and can make your refactoring our code structuring efforts easier.
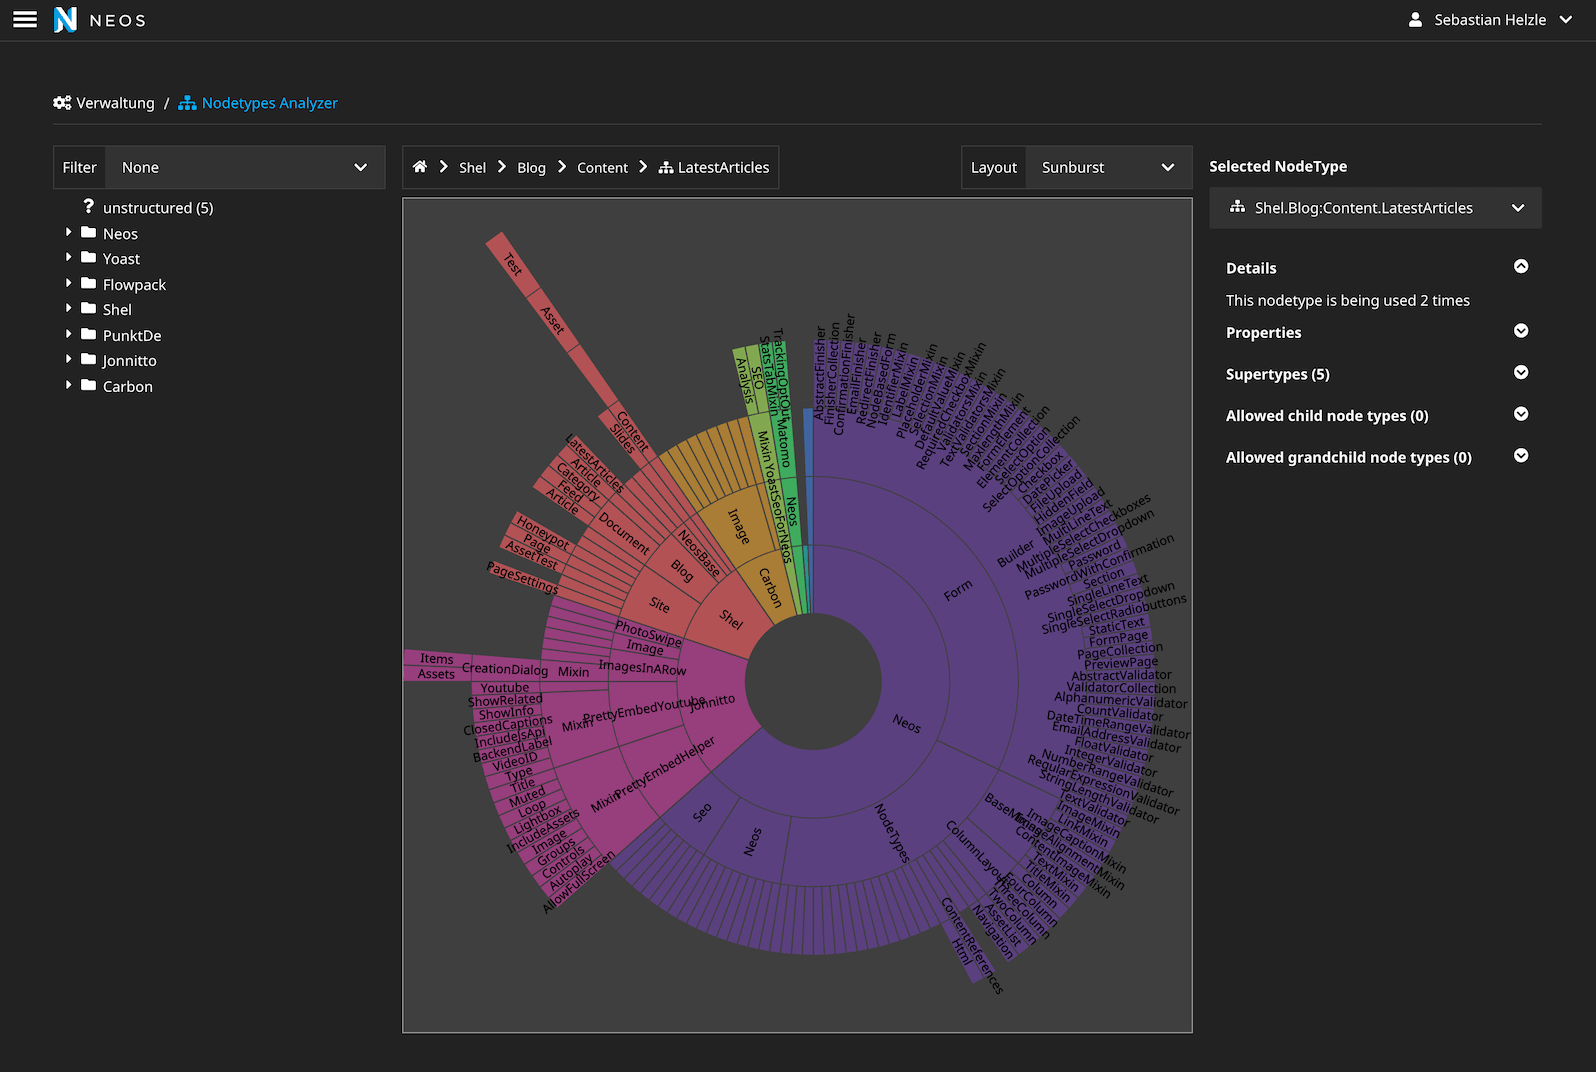
a view of the node types of different packages
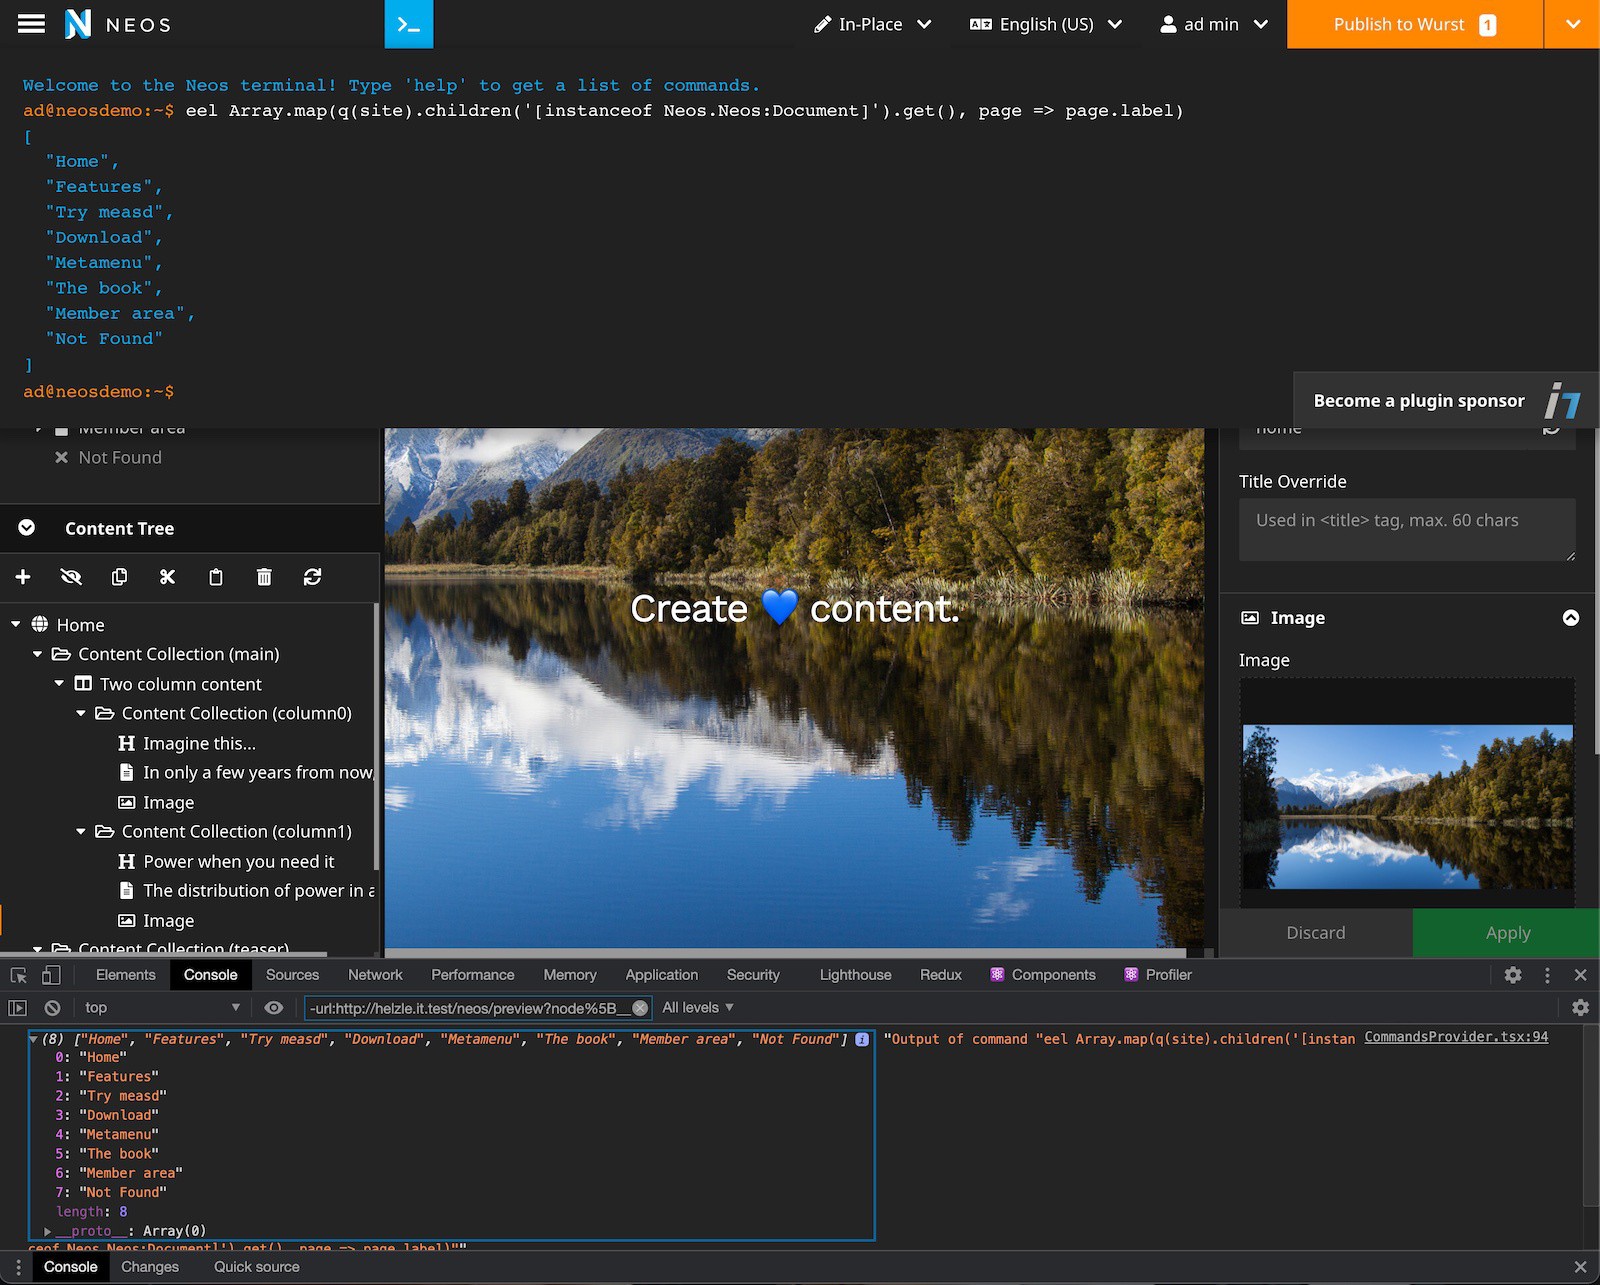
#Neos Terminal
This package by Sebastian Helzle allows to interact with Neos through a terminal, f.e. to evaluate Eel expressions in the current context or repairing Nodes.
a view of the node types of different packages
#t3n.Neos.Debug
This package is a helper package to add a debug panel to your Neos CMS website. At this point in time you're able to:
- debug your content cache configuration
- debug SQL queries
Additionally, the Server-Timing http header can be enabled that will add request timings to responses, which Those then can be viewed in the browser network tab.
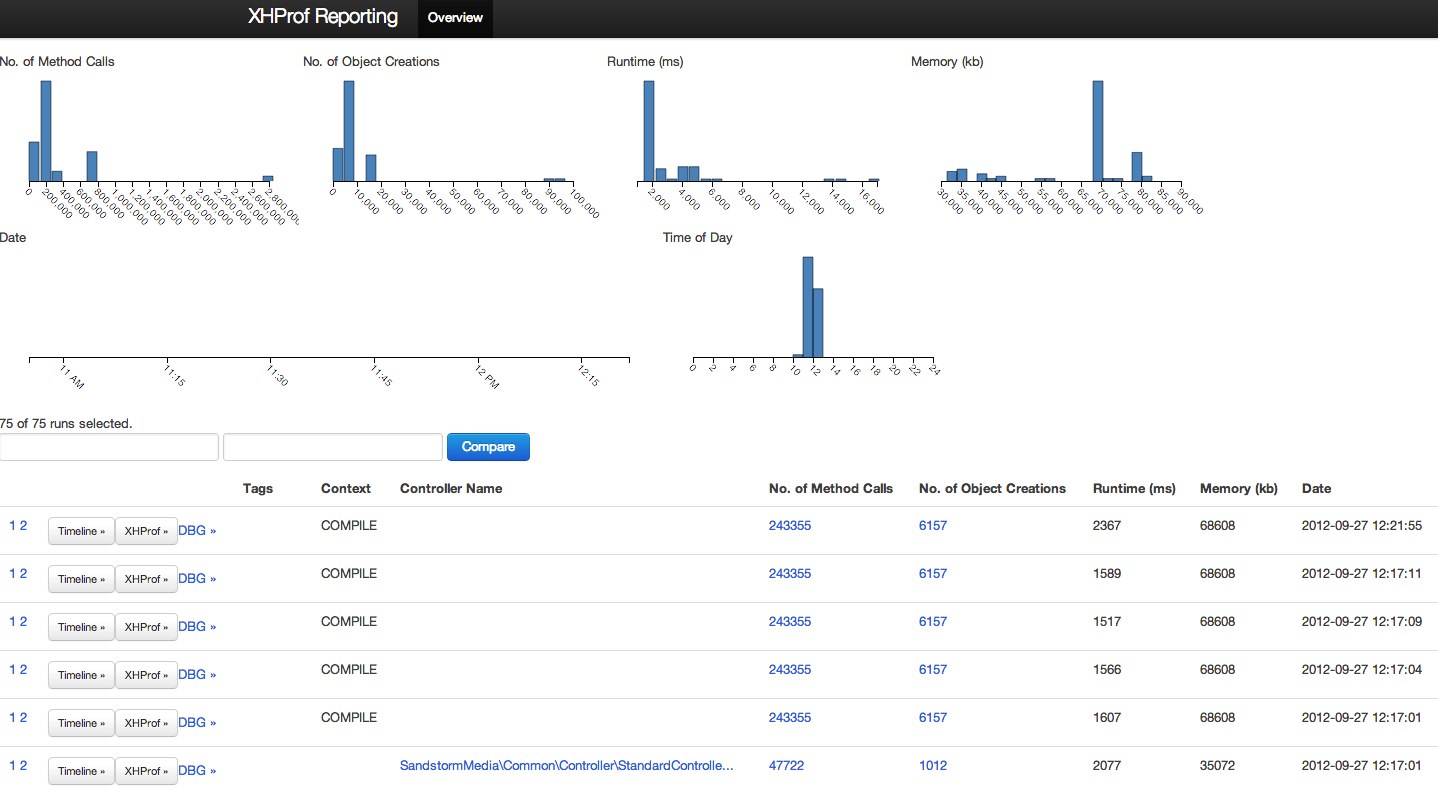
#Sandstorm.Plumber
This package by Sebastian Kurfürst is a profiling and tracing GUI for Neos and Flow. It supports the following features:
- list all profiling runs in an overview
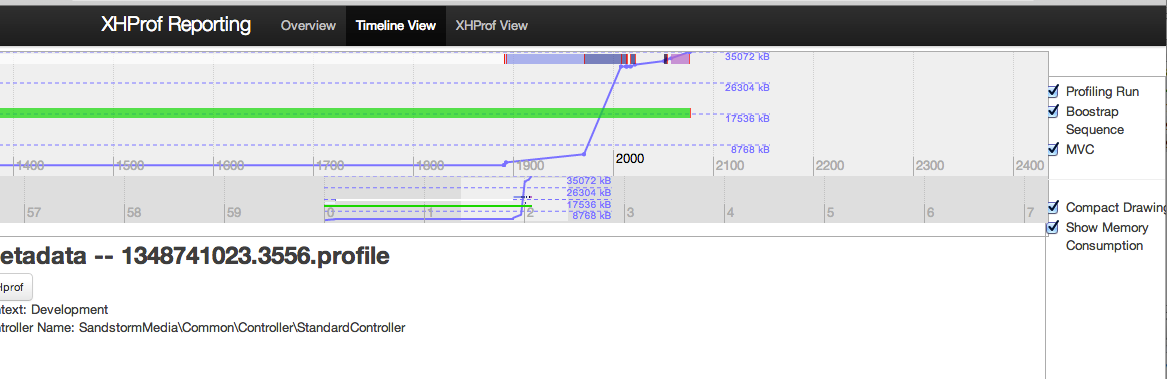
- show a graphical timeline for a single profiling run
- filter the graphical timeline
- show the xhprof analyzer for a single profiling run
- compare two profiling runs with the timeline
- tag your profiling runs
- show aggregated statistics in the overview